
| Shanghai Daq IoT Technology Co., Ltd. — Energy Management System |
|---|
| Version: V 1.1 |
System Overview
BRIEF INTRODUCTION
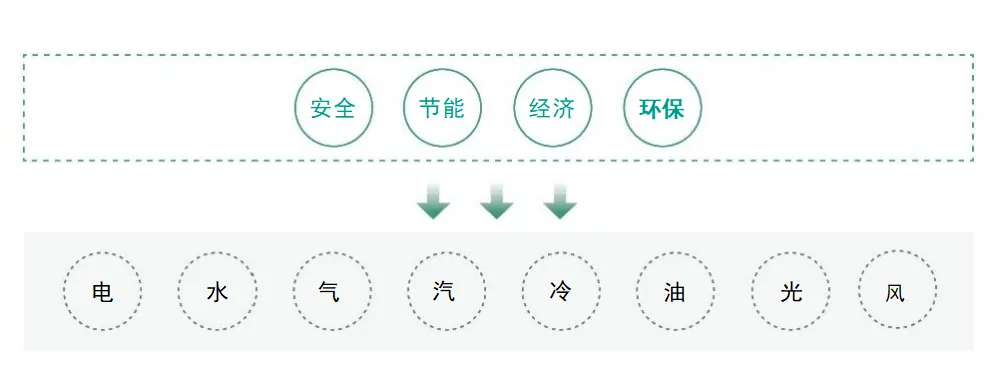
The energy management system is built on a modern service-oriented, cloud and mobile architecture. It acquires consumption data from every kind of energy monitoring point — power distribution, lighting, HVAC, water supply and drainage, gas and key equipment — and processes it into statistics by category, by sub-item, by time period and by area. Enterprises gain full visibility into energy use, see where consumption can be improved, optimize their energy use, cut overall consumption and reach their efficiency targets.
Main Functions
MAJOR FUNCTION
| Energy data acquisition | Energy data statistics | Line loss analysis | Energy alerts |
|---|---|---|---|
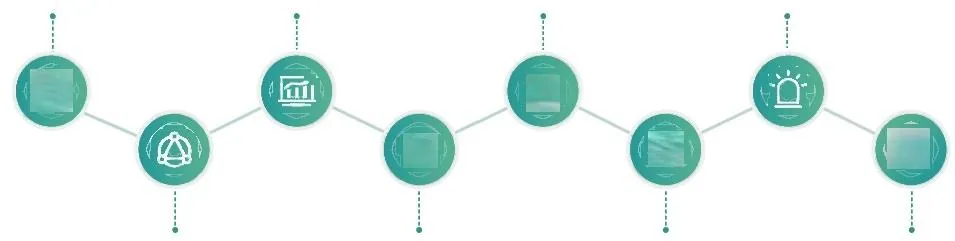
| Supports mainstream communication protocols and all common interfaces, wired or wireless | Automatic hourly / daily / monthly / annual statistics with year-on-year, period-on-period and share analysis; analysis by category, sub-item, area and group; consumption ranking | Detects leaks and losses promptly | Configurable safety and consumption thresholds with audible/visual, SMS and app alarms |
Energy forecasting
Algorithmic models produce consumption forecasts that help enterprises plan energy purchases sensibly.
Cost center
Consumption cost by area, calculated daily, monthly or annually.
Plan vs. actual
Set consumption plans and assess actual performance against them.
Energy indicators
Industry benchmarking to set energy efficiency targets.
Business Background
BUSINESS BACKGROUND
As energy grows scarcer and the environment deteriorates, securing affordable, convenient and clean energy has become an urgent question for human survival and sustainable development. Finding ways to use energy more efficiently is now a shared responsibility, from individual households to enterprises and governments. Water, electricity and gas equipment and the associated consumption categories are a major part of industrial facilities and public infrastructure, and sensible layout of energy facilities plus effective control functions can markedly raise facility and energy efficiency while lowering cost. For many enterprises, rising energy bills are a real constraint on growth. Applying modern information technology to build a safe, stable, reliable, economical and efficient energy management system matters a great deal for cutting costs and improving competitiveness.
Application Scenarios
APPLICATION SCENARIO
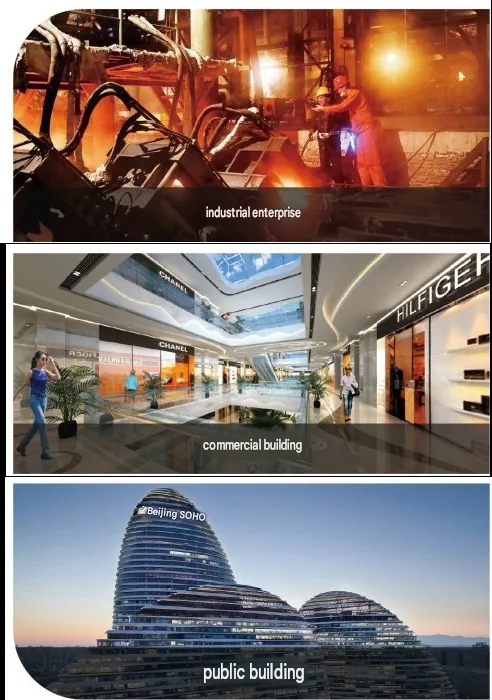
The energy management system applies to industrial enterprises, commercial buildings, public buildings and other energy-using sites. It gives owners a complete picture of energy use, exposes unreasonable consumption, and provides optimization advice, so energy is finally used safely, economically and cleanly.
Customer Value
CUSTOMER VALUE
Focused on saving energy, cutting consumption, reducing cost and raising efficiency for the enterprise.
Spot abnormal consumption and uncover savings potential
Optimize the energy mix and lower energy cost
Reduce equipment consumption and extend equipment life
Improve management efficiency and cut management cost
The system addresses the energy management challenges faced by managers at every level of the enterprise, with functions tailored to each, and helps them build a modern energy management framework.
Technical Characteristics
TECHNICAL CHARACTERISTICS
The system uses a leading technical architecture and development model. By building an open platform and developing professional applications, it creates an ecosystem around the energy management system.
Product Characteristics
PRODUCT CHARACTERISTICS
Power monitoring and energy management combined in one system
| More than a solution — industry experience as well | Energy management system | A strong ecosystem and shared capability center |
|---|---|---|
| Open system architecture, easy to integrate and be integrated |
System Architecture — Local Deployment
SYSTEM ARCHITECTURE-LOCAL DEPLOYMENT
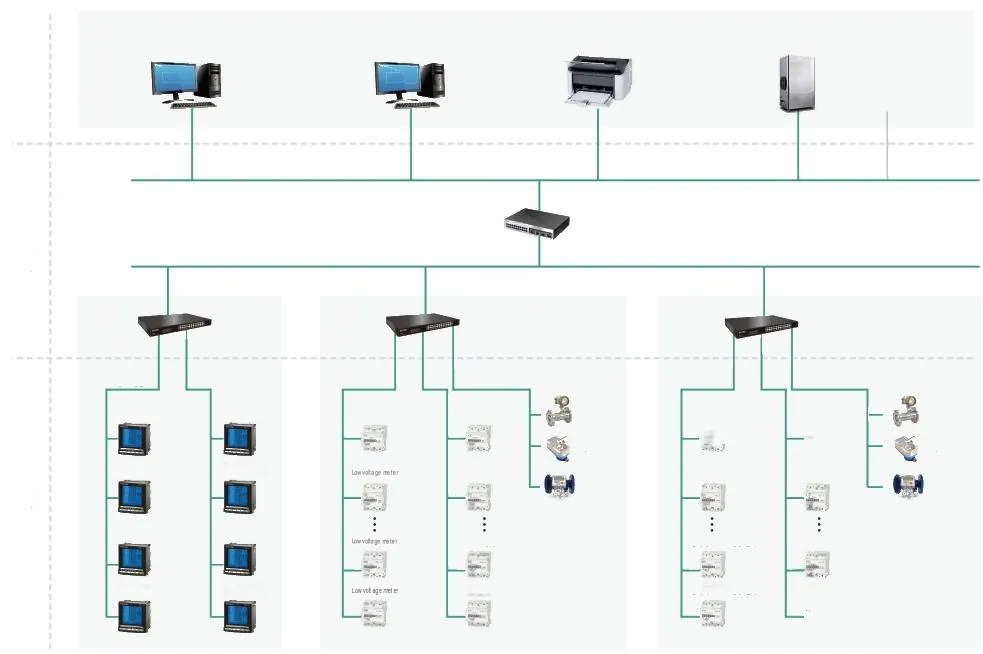
Application management layer
Built on a service-oriented and B/S architecture. It acquires, processes and stores energy data, and provides users with a range of web-based graphical data applications.
Network communication layer
Our DAQ communication management device converts fieldbuses to network connections on the LAN. It supports multiple serial ports and network ports and standards such as MODBUS, DL/T645 and MBus, and allows secondary development of communication protocols.
Field device layer
Fieldbus connections to the metering devices installed on site — electricity meters, water meters, flow meters and others — for real-time acquisition of consumption data.
System Architecture — Cloud Service
SYSTEM ARCHITECTURE — CLOUD SERVICES
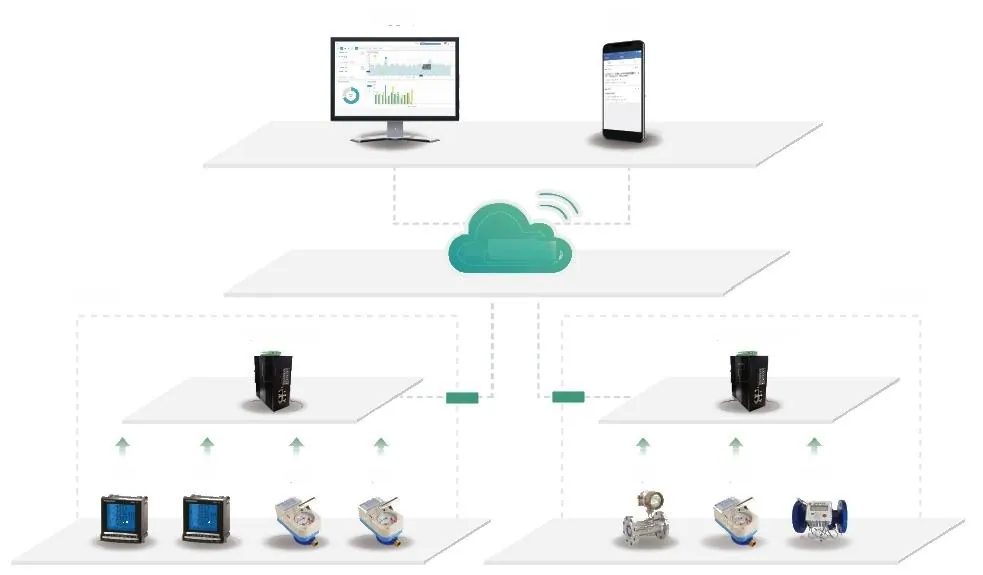
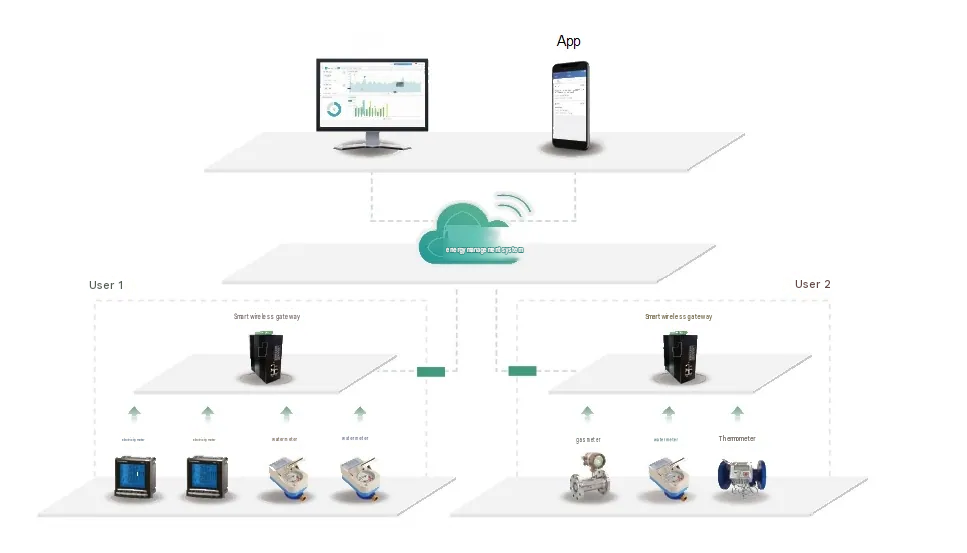
Users buy or rent no server hardware; they simply connect field devices to the energy management cloud platform through a gateway.
Users log in with the account assigned by the platform, from a browser or an app, and start using the energy management system.
The cloud service model is billed by number of connected devices and by usage time, so upfront investment is small.
System Functions
SYSTEM FUNCTION
A single screen shows overall consumption and its distribution across areas and energy media within the enterprise.
The latest technology reproduces the dynamic behavior of conventional SCADA and monitoring systems, with online SCADA configuration in the browser.
Users view live dynamic screens in a browser or in the app at any time.
Custom alarm strategies and alarm parameters catch consumption anomalies promptly, with rich notification channels: app, SMS and web.
Full life-cycle records for each device: product information, installation information, operating data, alarms and O&M history.
Consumption statistics by category, sub-item, area and department, presented graphically so a period of energy use is easy to read. Content includes volume, trend, share and ranking.
Power quality issues such as harmonics and three-phase imbalance are monitored and alarmed in real time.
Monitoring and analysis at both the energy inlet and outlet exposes water, electricity and gas leaks promptly and avoids waste.
Comprehensive efficiency analysis of large power users such as boilers, motors and air conditioners guides changes to operating modes and equipment retrofits.
Big data technology with several built-in mainstream load forecasting models supports precise energy purchasing plans.
Consumption indicators from peer companies help set the site’s own targets and benchmark actual consumption against them.
Based on web SCADA concepts and BI technology, users can design their own energy dashboard in minutes.
Project Implementation — Key Technologies
PROJECT IMPLEMENTATION-KEY TECHNOLOGY
The retrofit uses the latest smart sensors and wireless transmission: no meter replacement, no power shutdown, no communication cabling, no impact on production.
Wireless electricity meters · Non-destructive pipeline water measurement · Cloud photo data capture
Split-core transformers with inductive power harvesting need neither a power cable nor a communication cable.
Clamp-on ultrasonic measurement delivers water volume statistics with no pipe cutting and no flow stoppage — a non-destructive installation.
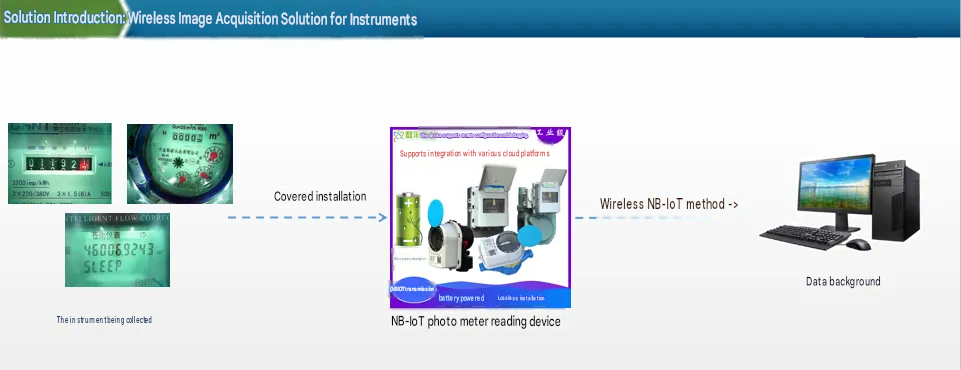
Acquisition approach for mechanical water, electricity and gas meters
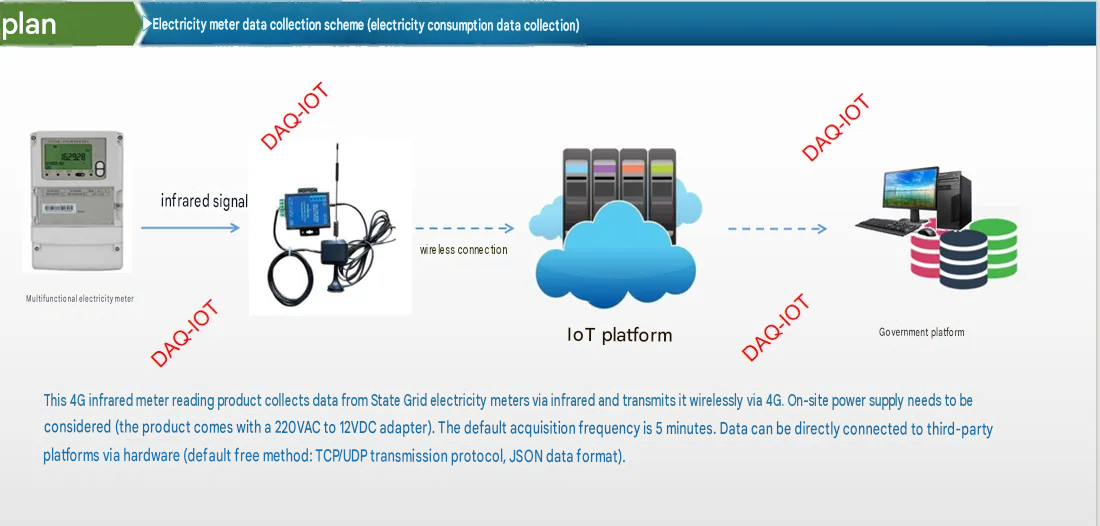
Electricity acquisition approach for electricity meters
Image recognition plus remote transmission needs no cabling and no meter replacement, and reads conventional water, gas and electricity meters of all kinds.
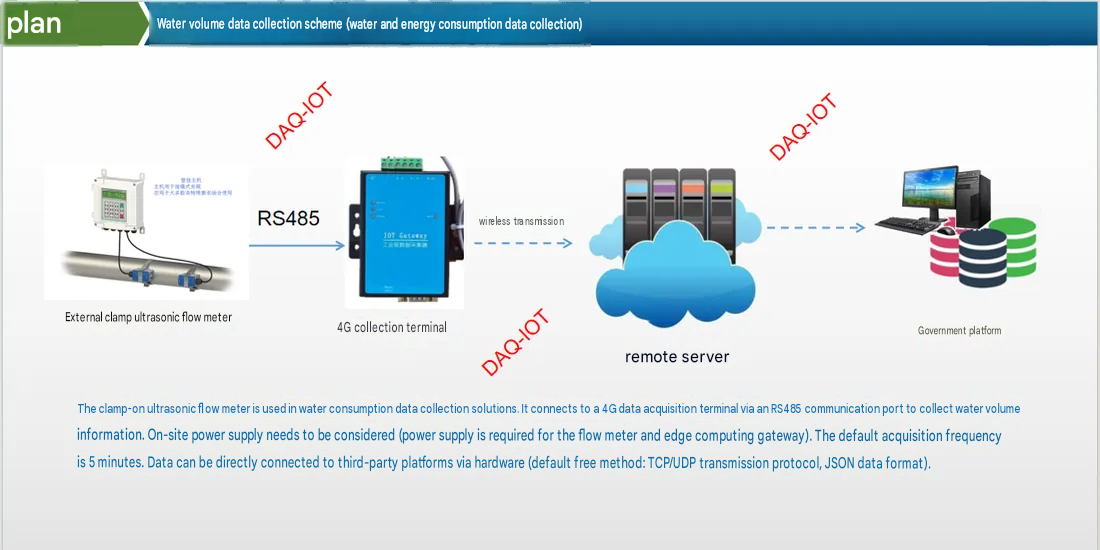
Non-destructive pipeline installation, water consumption acquisition
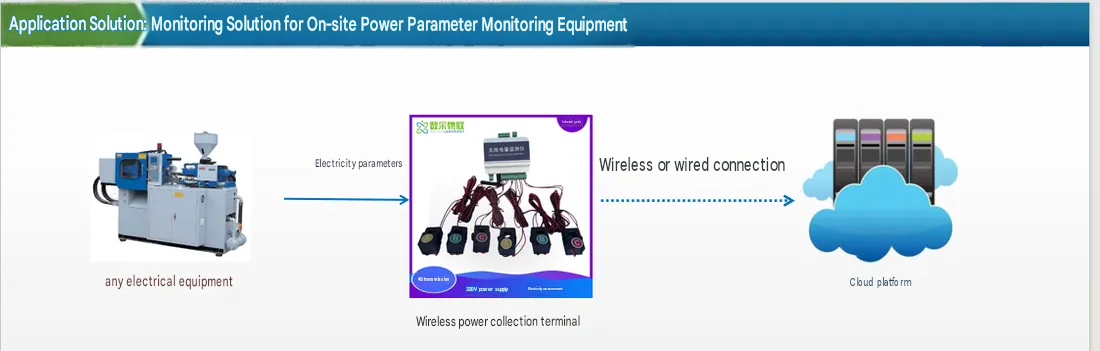
Electricity data acquisition where no meter is installed
Application Case — An Industrial Park in Hebei
SYSTEM APPLICATION CASE
Project overview: the park has more than 40 unattended box substations and hundreds each of water meters, gas meters and heat meters, which made management and O&M a major challenge.
Owner requirements:
1. Ensure electrical safety through the energy management system
2. Manage all energy use in the park effectively and keep reducing energy cost
3. Improve O&M and management efficiency through the cloud platform
Implementation: all smart devices were connected to the cloud platform over fieldbus plus a fiber optic network. Managers monitor and control the site from a browser or the app. The platform monitors more than a thousand metering devices in total, with over 400,000 data points.
Browser
Implementation results
Commercial Application Case
A Commercial Building in Qiantan, Shanghai
Project overview: a commercial and office complex of more than 200,000 square meters with many energy types and high consumption, where office tenants have stringent power quality requirements.
Owner requirements: on the basis of safe system operation, a detailed view of all consumption by category and sub-item, supporting continuous energy saving work and high-quality energy supply to tenants.
The energy management system offers several statistical modes — by category and sub-item, by area and by department — so users can see the building’s energy use at a glance.
Web SCADA functions are used to design the power system diagram and monitor power system operation in real time to keep the system safe. Load and consumption alarm thresholds are set for each circuit, and out-of-limit events are notified to O&M staff by SMS and app.
The system provides meter reading, year-on-year, period-on-period and ranking analysis, so the owner always knows where consumption is abnormal and where improvement matters most.
The energy management system supports real-time power quality monitoring and can generate power quality reports periodically, providing the most direct data basis for improving power quality and raising electricity efficiency.