
Factory Energy Monitoring System
Industrial transformation and smart manufacturing have made accurate collection, analysis and optimization of energy data central to cutting costs, raising efficiency and achieving sustainable growth. To give a plant a complete picture of how it consumes water, electricity and steam, and to warn of abnormal equipment operation in time, this solution builds on the DAQ-IOT technical framework and a dedicated data acquisition platform. It covers the full chain — data acquisition, dynamic monitoring, intelligent analysis, and alarm-driven O&M — and supports fine-grained energy management.
1. System Objectives
The system is built around data-driven energy optimization. A standardized, intelligent monitoring platform delivers three core tasks:
Full-dimension data visualization: real-time collection of plant water, electricity and steam data plus key equipment operating data, presented as dynamic charts, dashboards and similar views, so energy use is transparent at three levels — plant, area and equipment.
Proactive risk control: energy thresholds and equipment-status warnings raise an alarm in real time for equipment offline, excess consumption and similar conditions, reducing the energy waste and production loss caused by equipment faults.
Continuous energy efficiency improvement: historical comparison, trend forecasting and consumption ranking expose where energy is wasted, giving data support for shift scheduling and equipment retrofits, and ultimately lowering plant energy consumption and carbon emissions.
2. Core Architecture and Technical Parameters
(1) Software Architecture
The system uses a SCADA + ME + B/S hybrid architecture, combining industrial-grade data acquisition with web and mobile access, so acquisition stays stable and monitoring stays convenient.
SCADA layer: acquires data from field devices (water meters, electricity meters, steam meters, PLCs) in real time, with a configurable interval from 1 minute to 24 hours for timely, accurate data.
ME layer: processes and stores data — cleaning, consolidating and backing up consumption data — and connects to the plant’s existing production systems to relate energy use to output.
B/S layer: provides web and mobile access, so managers can check consumption trends, equipment status and alarms from a PC or phone without installing a client.
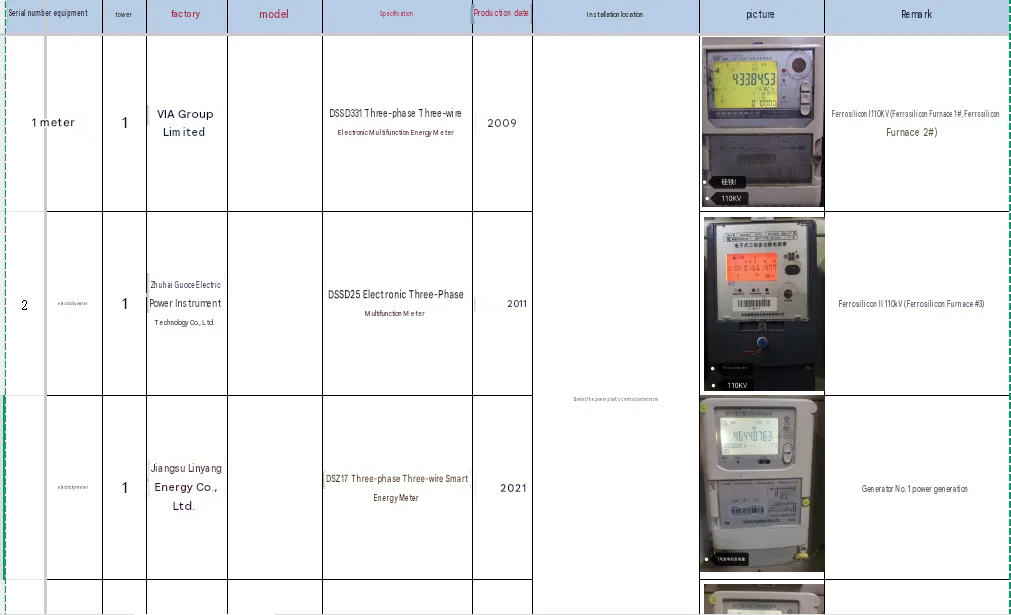
(3) Hardware Specifications and Site Instrument Survey
To keep the system running reliably, hardware follows industrial-grade standards. Core equipment parameters:
| Hardware | Model / spec | Qty | Function | Remarks |
|---|---|---|---|---|
| Industrial PC | 10th-gen Core i7-10700 / 32 GB RAM / 500 GB SSD + 2 TB HDD / discrete RTX 3060 with 12 GB VRAM | 1 set | Host system for data processing, screen display and command output | |
| Monitor | 21-inch industrial monitor | 1 set | Paired with the IPC for live on-site monitoring | |
| Input devices | Keyboard and mouse set | 1 set | Operator input | |
| Switch | Multi-port industrial switch | 1 set | Network link between field acquisition devices and the IPC |
Information to be collected on site: the energy meters to be monitored (water, electricity, gas and similar) and the PLCs behind the terminal equipment.
(3) System Function Modules
Data Acquisition and Storage Module
Covers water, electricity and steam plus key production equipment, collecting consumption data (cumulative energy in kWh, instantaneous power in kW) and equipment operating parameters (temperature, pressure) in real time.
Data is stored automatically for up to 3 years and can be downloaded as Excel files, meeting energy audit and historical traceability needs. Backup lets the system be restored quickly from a backup file after a fault, so no data is lost.
Dynamic Monitoring and Visualization Module
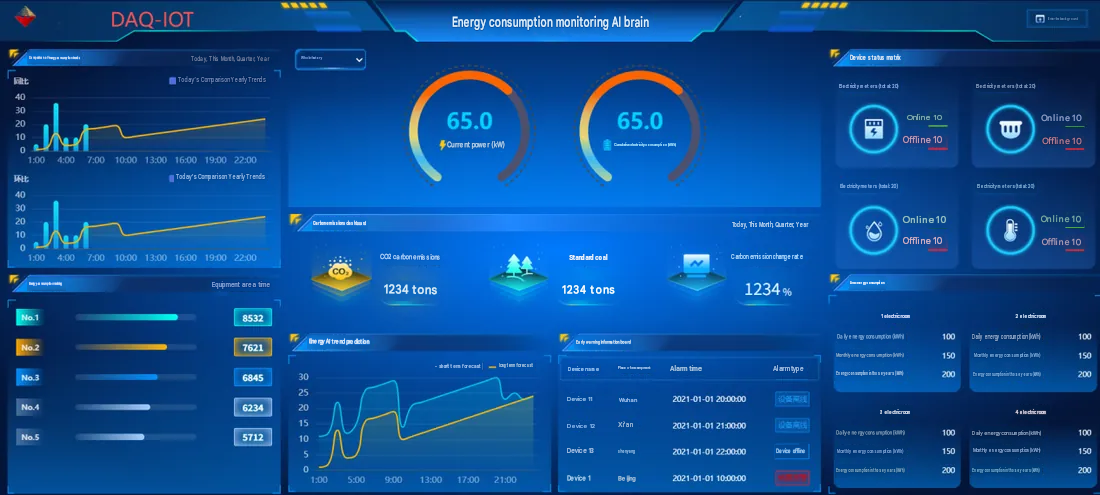
The home screen uses 2D dynamic graphics with three-level drill-down — energy overview, area consumption, single-device consumption — displayed in a grid or carousel.
Core dashboards:
Consumption trend dashboard: switch between today, this month, this quarter and this year, and compare with the same period in previous years to show how consumption is changing.
Carbon dashboard: calculates CO₂ emissions and standard coal consumption in real time and shows the rate of change.
Equipment status matrix: shows the online/offline status of electricity meters and other acquisition devices in real time, marking offline devices in red automatically.
Intelligent Analysis and Forecasting Module
Consumption ranking: ranks consumption by equipment, area and time period to identify high-consumption areas (for example, Electrical Room 1 and Electrical Room 2 each used 100 kWh today, which needs attention).
Trend forecasting: short-term (1 hour to 24 hours) and long-term (1 week to 1 month) forecasts with curves (for example, forecast values of 7621 kWh, 6845 kWh, 6234 kWh and 5712 kWh) to support production planning.
Energy per unit output: relates consumption data to output data, calculates energy per unit of output every hour and flags high-energy, low-output conditions.
Alarm and O&M Module
Alarms cover equipment offline, excess consumption and parameter anomalies, with user-defined thresholds (for example, an alarm when power exceeds 100 kW).
Alarm messages are pushed to the web and mobile clients with device name, location and time (for example, “Device 11, Wuhan, 2021-01-01 20:00:00, device offline”).
Guided alarm handling, plus alarm record query and statistics, makes recurring fault points easier to analyze.
3. Implementation and Acceptance Criteria
(1) Implementation Process
Survey stage: test on site how the existing hardware (switches, meters) and software work together, confirm communication IP addresses and link stability; the plant provides the communication configuration list for the energy and equipment sides.
Design stage: issue an electronic design proposal that sets out the 2.5D dynamic display screens in detail, laid out around the production floor; development starts once the plant approves.
Development and commissioning stage: complete the software modules, hardware installation and system integration test, focusing on data accuracy, screen responsiveness and alarm response time.
Training and handover stage: train plant operators on operation and maintenance, and hand over system backup files, manuals (2 printed copies and 1 electronic copy) and qualification documents.
(2) Acceptance Criteria
Hardware: packaging undamaged, electrical components free of wear or deformation, and the IPC, switch and other devices matching the technical specification.
Function: acquisition interval as configured, trend comparison and ranking working, alarm response ≤1 minute, and clear 2D screens.
Documentation: complete certificates, warranty cards, operating manual (including fault handling and a maintenance schedule) and a consumables list (brand, specification, contact details).
Service: after training, operators can run the system unaided; 24 months of free operation and maintenance with no software maintenance fee during that period.
4. System O&M and Support
Routine maintenance: the plant checks the IPC and switch monthly against the manual, clears dust, and backs up data quarterly to keep it safe.
Fault handling: when the system fails, the plant can first try restoring from a backup file; if that does not resolve it, response within 2 hours and prompt repair.
Future expansion: the system reserves interfaces for water meters, electricity meters, steam meters and equipment-side acquisition. Technical support for added equipment keeps those interfaces compatible.
With standardized hardware and software, end-to-end function design and strict acceptance criteria, the solution delivers an energy monitoring system that can be deployed and extended. Once running, it raises the plant’s energy management efficiency, provides solid data support for greener production and cost optimization, and helps the plant reach its goals of lower cost, lower energy use and lower carbon.