
Chapter 1. Project Overview and Requirements Analysis
1.1 Project Background
As Industry 4.0 and smart manufacturing gain momentum, digital transformation has become a key path for enterprises to strengthen their core competitiveness and achieve sustainable development. Smart buildings are a major application scenario for industrial IoT technology, and their HVAC, water supply and drainage, and energy management systems increasingly need fine-grained, intelligent monitoring. This project builds an advanced, reliable and open SCADA monitoring system that gives real-time visibility of equipment status across the building, centralized monitoring, intelligent control and data analysis. The goals are equipment safety, optimized operating strategies, lower energy consumption and higher management efficiency.
1.2 Requirements Analysis
List of monitored objects in this project
| Monitored/Controlled Device | Acquisition/Control Parameters | Qty |
|---|---|---|
| Motor vibration sensor | Vibration velocity: 0~20 mm/s | |
| Vibration displacement: 0~200 μm | 3 | |
| Modulating air damper actuator | Signal type: analog signal |
Control type: electric control Torque: 15 NM | 7 | | Modulating water valve | Signal type: analog signal Control type: electric control | 80 | | Duct-type temperature and humidity sensor | Measuring range: 0~50 °C, 0~100 %RH; Signal type: analog signal; | 7 | | Duct-type differential pressure sensor | Measuring range: -2500~0 Pa; Signal type: analog signal; | 2 | | Duct-type pressure sensor | Measuring range: 0~1000 Pa; Signal type: analog signal; | 5 | | Air volume and velocity sensor | Signal type: analog signal + Modbus RTU; | 1 | | On/off air damper actuator | Signal type: digital signal Control type: electric control Torque: 15 NM | 7 | | On/off water valve | Signal type: digital signal Control type: electric control | 2 | | Air-conditioning differential pressure switch | Measuring range: 0~500 Pa; Signal type: digital signal; | 42 | | Flow meter | Signal type: analog signal + Modbus RTU; | 5 | | Air-line dew point sensor | Measuring range: -80~20 °C DP; Signal type: analog signal; | 1 |
(The table has more rows; only the first 12 are shown here.)
The acquisition and control objects in this project are diverse and the system is complex. They fall into the following main areas:
Monitoring a large number of actuators:
This covers 7 on/off air damper actuators, 7 modulating air damper actuators, and as many as 85 on/off and modulating water valves and steam regulating water valves in all pipe sizes (DN20 to DN250).
Comprehensive environmental parameter monitoring:
This covers duct pressure and differential pressure (5 units), indoor and outdoor pressure (15 units), water pipe pressure (12 units), indoor, outdoor and duct temperature and humidity (62 units), water pipe temperature (11 units), dew point (1 unit) and more. The system therefore needs strong analog signal acquisition and data processing capability to reflect actual environmental conditions.
Multiple types of flow and level monitoring:
This covers remote water meters, liquid and gas flow meters, air volume and velocity sensors, and level sensors, with signal types spanning Modbus RTU and analog. The SCADA system must support multiple protocols and calculate and display instantaneous and cumulative flow flexibly.
Monitoring of key equipment status:
The 3 motor vibration sensors show that the system needs basic predictive maintenance capability, warning of equipment faults by monitoring vibration data.
Advanced software platform requirements: a historical data server, a SCADA server and energy management software are required, reflecting the customer’s high-level requirements for data visualization, historical data analysis, energy efficiency management and system integration.
Shanghai Daq IoT, a member of the expert pool for “intelligent upgrade and digital transformation”, draws on decades of experience in industrial IoT data acquisition to deliver a complete solution tailored to this project.
Chapter 2. Overall System Design
2.1 Design Principles
The solution follows these core principles:
Advancement: proven industrial IoT, cloud computing and big data analytics technologies keep the system ahead of the curve for years to come.
Reliability: critical equipment such as controllers, networks and servers uses redundant design, and industrial-grade products are selected for high reliability, so the system runs 7x24 without interruption.
Openness: the system uses standard, open protocols such as Modbus TCP/RTU and MQTT, so it integrates easily with third-party systems such as building automation and ERP, and data can be shared.
Scalability: a modular, distributed architecture leaves ample expansion interfaces and capacity in both hardware and software, so monitoring points or new functions can be added later.
Ease of use: a friendly human-machine interface, simple operation and complete alarm management and reporting lower the technical barrier for O&M staff.
Security: protection is built at several layers, from network boundary and data transmission to user permissions, against unauthorized access and attacks.
2.2 System Architecture
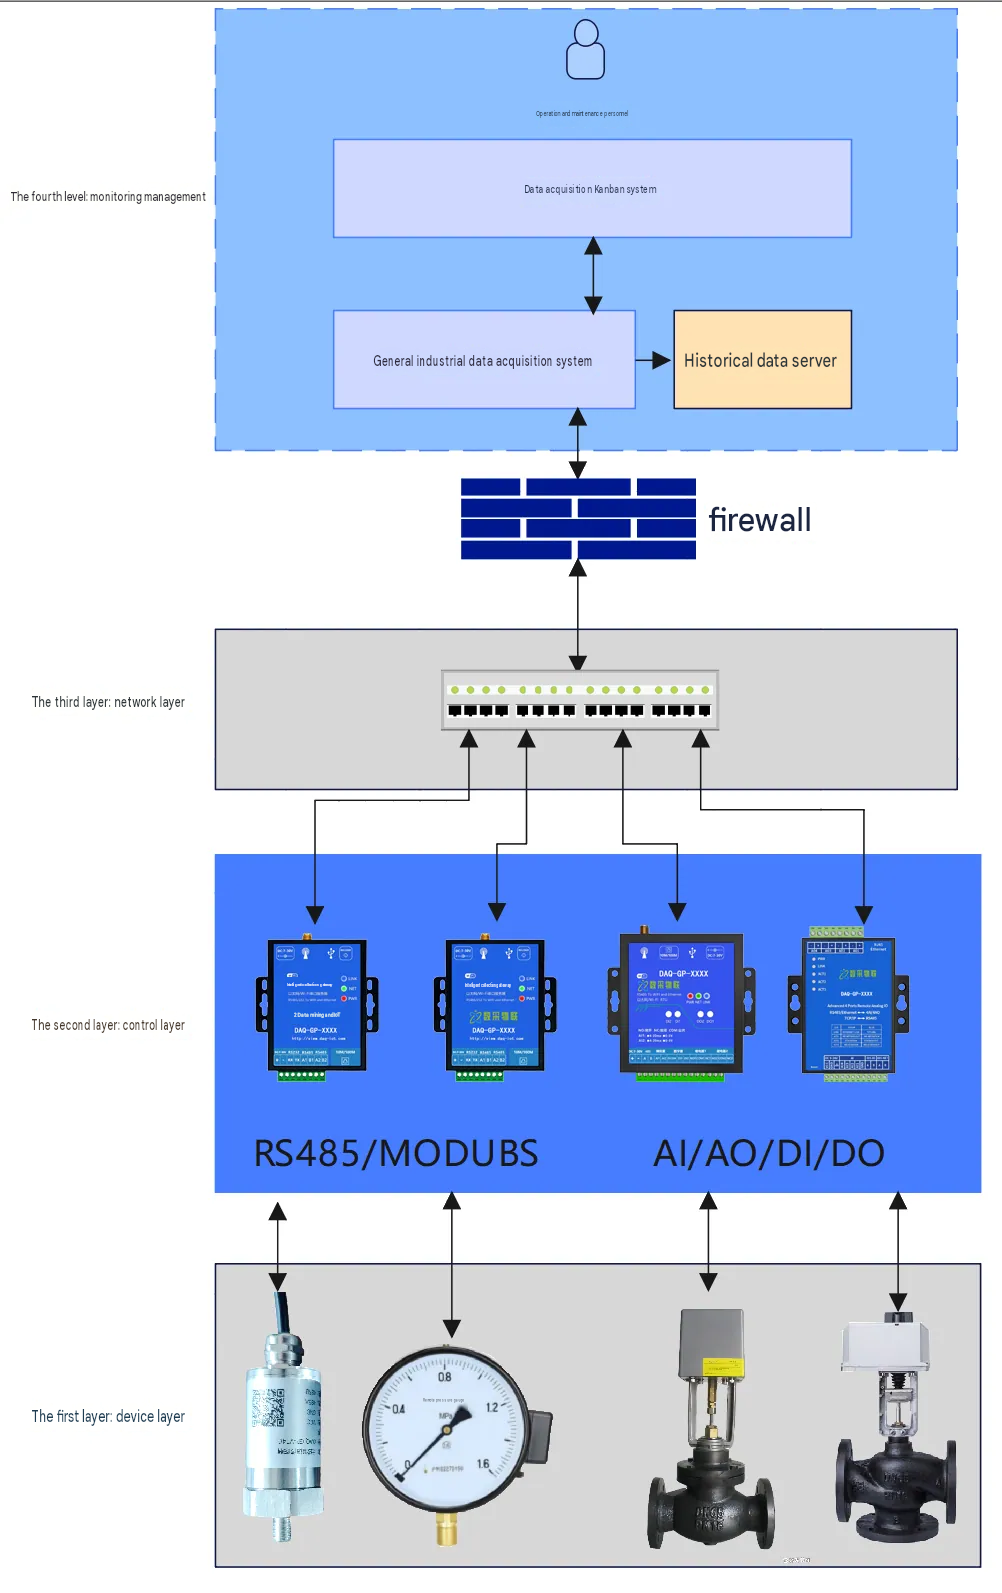
The system uses a typical layered, distributed architecture, from bottom to top: device layer, control layer, network layer and monitoring and management layer.
1. Device Layer
The bottom layer contains all field devices listed in the Acquisition Requirements: sensors, actuators, valves, flow meters and instruments. They are the “senses” and “hands” of the system, acquiring physical parameters and executing control commands.
2. Control Layer
This layer is the core of data acquisition and control. Depending on device locations and functional zones, we deploy several series of analog and digital IoT gateways and edge controllers developed in-house.
For digital and analog devices: intelligent IO modules supporting multiple DI/DO/AI/AO channels connect actuators and sensors nearby and exchange data with the communication gateway over an RS-485 bus, for example with the Modbus RTU protocol.
For smart instruments: remote water meters, flow meters and similar devices that support Modbus RTU connect directly to the communication gateway over RS-485.
Gateway functions: the communication gateway is the key link between layers. It polls all downstream IO modules and smart instruments, performs protocol conversion, data filtering and edge computing (unit conversion, preliminary alarm evaluation), and uploads standardized data to the monitoring layer servers over industrial Ethernet. The gateway also receives control commands from the upper layer and issues them to the corresponding actuators.
3. Network Layer
This layer handles data communication between system levels.
Control network: industrial Ethernet with core switches and ring switches forms a high-speed, reliable backbone. Two core switches use redundant ring technology, so a single point of failure does not interrupt overall communication.
Information network: servers, operator stations, video walls and other equipment in the monitoring center are connected over a LAN.
Network security: industrial firewalls at the network boundary strictly isolate the control network from the information network and guard against cyber attacks.
4. Monitoring and Management Layer
Located in the monitoring center, this layer is the “brain” of the system. It provides visual monitoring, data management and the human-machine interface.
Hardware: SCADA servers, historical data servers and other equipment.
Software platform: a high-performance, highly reliable SCADA platform (our in-house general industrial data acquisition system and Daq IoT dashboard system), together with historical database software and energy management software. The platform aggregates, processes, stores, displays and controls all field data.
2.3 System Topology
Chapter 3. Detailed Hardware Design
3.1 Data Acquisition and Control Units
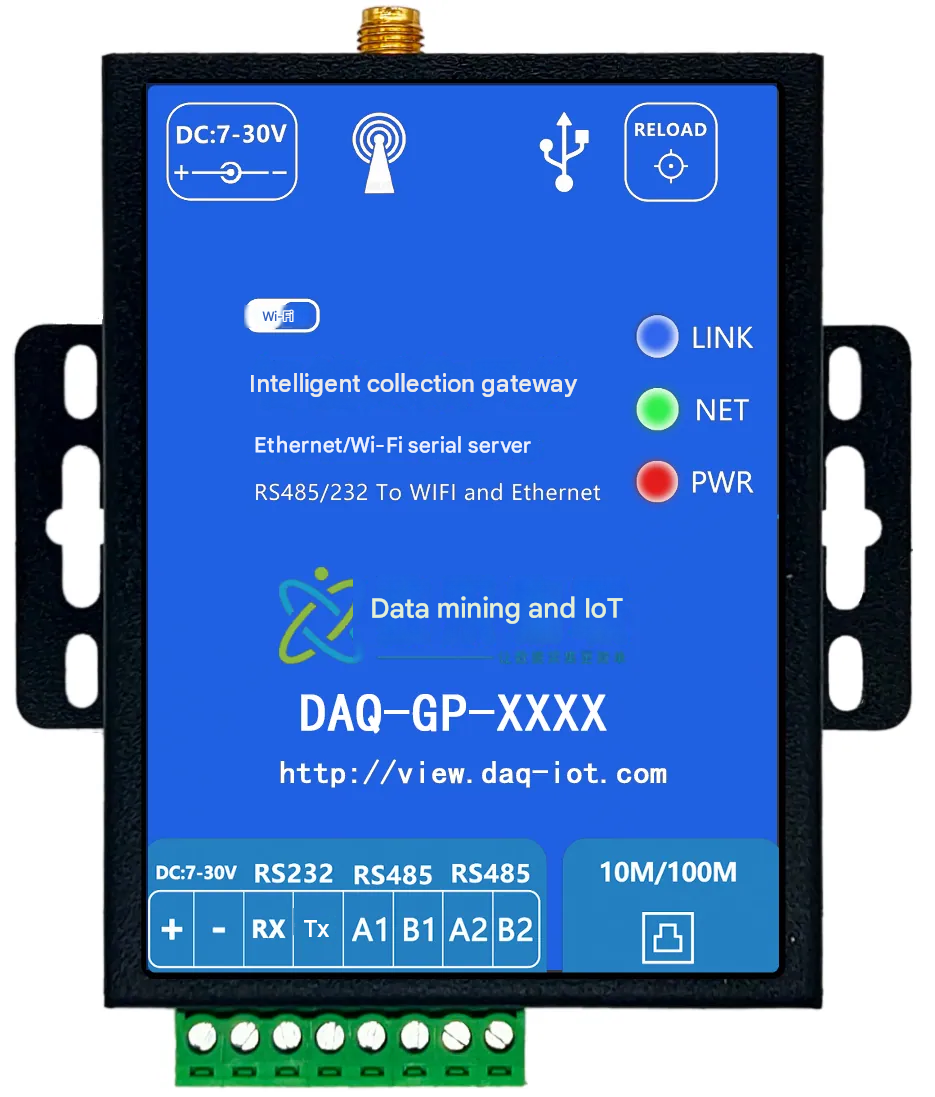
Shanghai Daq IoT supplies high-performance industrial IoT gateways and IO modules.
IoT gateway: a multi-protocol gateway with at least one Ethernet port and multiple RS-485 ports, supporting edge computing and data buffering. Gateways are grouped by device location to keep cabling to a minimum.
IO modules:
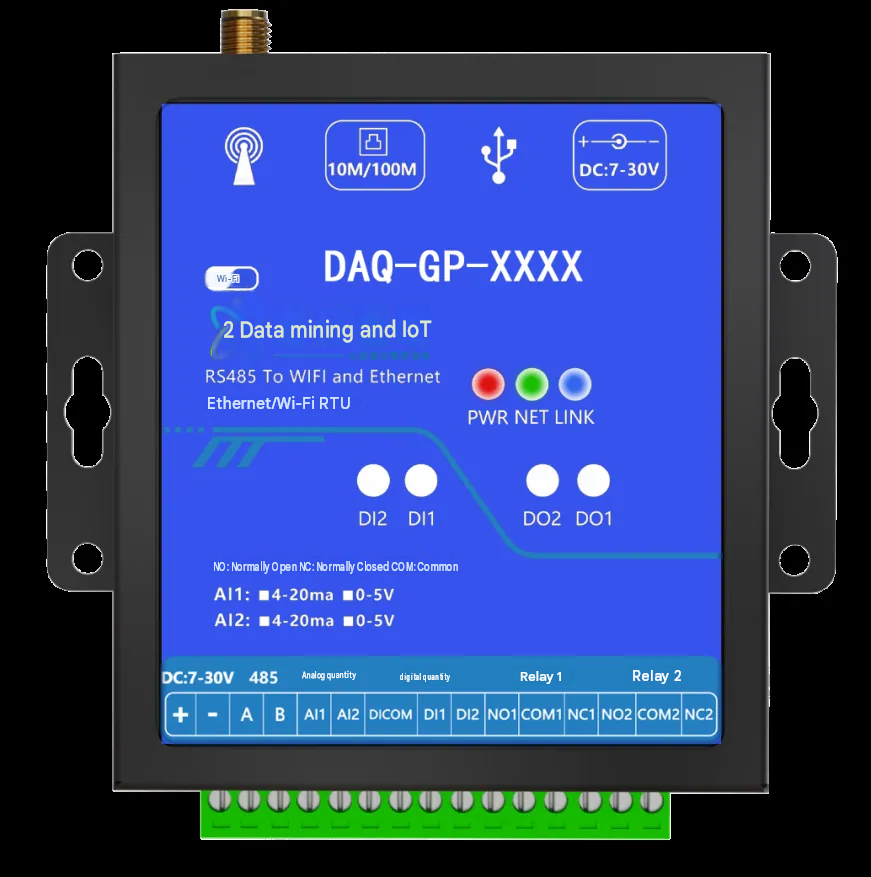
Digital input module: acquires switching status signals from devices such as air-conditioning differential pressure switches.
Digital output module: controls on/off air damper and water valve actuators.
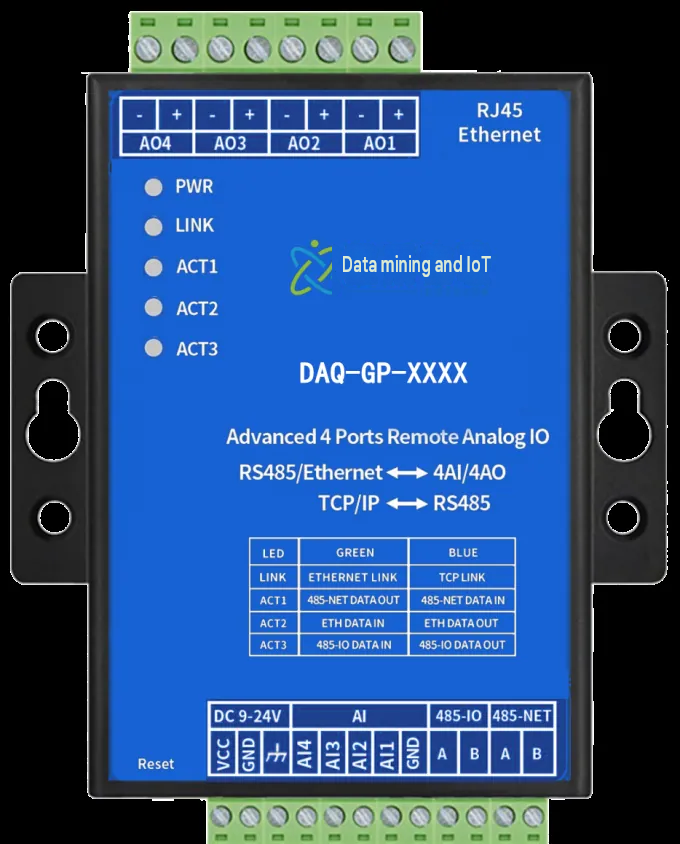
Analog input module: acquires 4-20 mA or 0-10 V standard signals from pressure, temperature, humidity, differential pressure and level sensors. Module accuracy must exceed sensor accuracy, for example 16-bit resolution.
Analog output module: controls modulating air damper and water valve actuators with a 4-20 mA output for precise valve position control.
3.2 Monitoring Center Hardware Design
The monitoring center hardware is specified for reliability, performance and future expansion.
Servers: two high-performance servers. One is configured as the SCADA server; the other is the historical data server, dedicated to long-term storage of historical data.
Operator stations and engineering station: three high-performance PCs for daily monitoring. One of them doubles as the engineering station for system configuration, programming and maintenance.
Network equipment: one 24-port managed core switch and five ring switches form a stable network. One industrial firewall provides security zone isolation.
Cabinets and console: a 42U server cabinet and a 12U network cabinet with structured cabling for heat dissipation and easy maintenance. A two-position console provides a comfortable working environment.
Video wall: displays the system overview, process diagrams, key parameters and alarm messages in one place, so managers can see the operating status at a glance.
3.3 Network and Cabling System
Cable selection:
Power and control cables: RVV series for power supply and digital signals. Shielded RVVP and RVSP series for analog signals and communication lines, providing effective immunity to electromagnetic interference.
Network cables: Cat 6 twisted pair for LAN cabling. 4-core single-mode or multimode fiber for long-distance or cross-building links, with high bandwidth and strong interference immunity.
Installation:
All cables run in metal cable trays (200x100 mm) and JDG/KBG conduits, in line with industrial safety rules, neat and easy to maintain. Cable tray supports are corrosion-treated as required.
Chapter 4. Detailed Software Design
4.1 SCADA Monitoring Software Platform
The software platform is the soul of the system and provides these core functions:
Graphical human-machine interface: vector-based process diagrams show equipment status and live parameters such as temperature, pressure, flow and valve position in an intuitive way. Screens support multi-level zoom and navigation.
Real-time and historical databases: the real-time database handles fast-changing data. The historical database uses efficient compression to store all key data long term, forming the basis for trend analysis and reports.
Alarm management: a complete alarm mechanism. Multiple alarm limits can be set per monitoring point (high, high-high, low, low-low). Alarms are displayed and logged in real time and can be notified by audible and visual alarm, SMS or voice call. Alarm summary and history query are provided.
Trend analysis: real-time and historical trend curves let operators compare several variables over the same period, which helps with root-cause analysis and process optimization.
User management and security: strict permission management distinguishes administrators, engineers and operators, each with different operating and viewing rights. All important operations are logged for traceability.
Reports: standard and custom reports can be generated automatically as daily, monthly and annual reports, covering energy statistics, equipment run time and alarm statistics, and exported to Excel or PDF.
4.2 Energy Management Software Module
Energy management is a focus of this project. The module provides:
Energy dashboard: total electricity, water and gas consumption in one view, plus consumption by sub-item such as air conditioning, lighting and power.
Energy statistics and analysis: consumption statistics by hour, day, month and year, with energy use per unit area. Year-on-year and month-on-month comparisons help identify anomalies and savings potential.
Energy efficiency assessment: real-time calculation and monitoring of the efficiency of key equipment such as chillers and pumps.
Energy-saving strategy optimization: based on historical data and preset strategies, the system recommends equipment start/stop optimization and variable-frequency speed optimization, or applies automatic control directly.
4.3 System Integration and Communication Interfaces
The system uses international standard interfaces such as Modbus RTU/TCP, HTTP and MQTT, so it integrates easily with:
Enterprise building automation systems: for deeper interlocking control.
Enterprise resource planning systems: to supply real energy and equipment operating data for management decisions.
Cloud platforms: data can be pushed to the cloud for mobile O&M and big data analytics.
Chapter 5. System Functions
5.1 Main Monitoring Functions
HVAC System Monitoring
Temperature and humidity control: water valve and air damper positions are adjusted automatically from indoor and outdoor sensor readings to keep the environment comfortable.
Air balance: duct pressure sensors and damper actuators maintain pressure balance in the supply, return and exhaust air systems.
Filter alarms: differential pressure switches detect filter clogging and raise an alarm to clean or replace the filter.
Water Supply and Drainage Monitoring
Pump interlocking control: pump start/stop or variable-speed operation is controlled automatically against the water pipe pressure setpoint.
Tank level monitoring: tank levels are monitored with high-high and low-low level alarms, which can interlock with the inlet valve.
Water system balance: modulating valves on each branch achieve hydraulic balance and ensure supply at the terminals.
Equipment Operation Management and Early Warning
Start/stop control and status monitoring: remote manual or automatic start/stop, with monitoring of running, fault and manual/auto status.
Run-time statistics: equipment run time is accumulated automatically as a basis for scheduled maintenance.
Predictive maintenance: motor vibration data is monitored and analyzed, and an early warning is raised when vibration exceeds the limit, preventing sudden equipment failure.
5.2 Data Acquisition and Processing Flow
Data acquisition: the communication gateway polls each IO module and smart instrument at a preset cycle, configurable, for example 1 second.
Protocol conversion: the gateway converts data from different protocols, such as Modbus RTU, into uniform TCP/IP packets.
Data transmission: data is uploaded to the SCADA server over industrial Ethernet.
Data processing: the SCADA server performs engineering unit conversion, range scaling, alarm checking and data filtering.
Data storage and display: processed data is written to both the real-time and historical databases, and the human-machine interface is updated.
Control Command Delivery: The operator issues a control command on the HMI. The command passes through the SCADA server and the gateway and finally reaches the designated IO module or actuator.
Chapter 6. Implementation, Commissioning and Training Services
Shanghai Daq IoT provides end-to-end services to make the project a success.
Project implementation flow: project kickoff -> detailed design -> equipment procurement and acceptance -> hardware installation and cabling -> software configuration and development -> system integration testing -> trial run -> final acceptance.
System commissioning: point-by-point checks (each sensor and actuator signal verified), subsystem commissioning and full-system interlocking tests, with various operating conditions simulated to verify stability and reliability.
Technical training: training at several levels for the customer’s O&M staff, including:
Basic operation training: for general operators, covering daily monitoring, alarm handling and report queries.
Advanced maintenance training: for engineers, covering system hardware and software structure, fault diagnosis, program modification and database maintenance.
Chapter 7. Solution Advantages and Summary
This solution was developed by Shanghai Daq IoT Technology Co., Ltd. and offers clear advantages:
Expertise: the solution fits the customer’s requirements closely, with sound design and thorough attention to detail, reflecting the company’s depth of experience in industrial IoT.
Completeness: an end-to-end solution from field sensing and data transmission to central monitoring, with hardware and software integrated seamlessly.
Reliability: redundancy at critical points and industrial-grade products ensure high availability.
Intelligence: beyond basic monitoring, energy management and predictive maintenance create value that goes further than monitoring alone.